In this tutorial we're looking at the electrokinetics feature of ESPResSo, which allows us to describe the motion of potentially charged chemical species solvated in a fluid on a continuum level. The govering equations for the solvent are known as the Poisson-Nernst-Planck equations, which is the combination of the electrostatic Poisson equation and the dynamics of the chemical species described by the Nernst-Planck equation. For the advection we solve the incompressible Navier-Stokes equation. The total set of equations is given by
\begin{aligned} \partial_{t} n_{i} &= - \vec{\nabla} \cdot \vec{j}_{i} \\ \vec{j}_{i} &= - D_{i} \vec{\nabla} n_{i} - \frac{z_{i} e}{k_{B} T} n_{i} \vec{\nabla} \phi + n_{i} \vec{u} \\ \Delta \phi &= \frac{1}{4 \pi \varepsilon_{0} \varepsilon_{\mathrm{r}}} \sum_{i} z_{i} e n_{i} \\ \rho (\partial_{t} \vec{u} + (\vec{u} \cdot \vec{\nabla}) \vec{u}) &= - \vec{\nabla} p + \eta \Delta \vec{u} + \sum_{i} \frac{k_{B} T}{D_{i}} \vec{j}_{i} + \vec{f}_{\mathrm{ext}} \\ \vec{\nabla} \cdot \vec{u} &= 0, \end{aligned}where $n_{i}$ denotes the ion density of species $i$, $\vec{j}_{i}$ the density flux, $D_{i}$ the diffusion coefficient, $z_{i}$ the valency, $e$ the elementary charge, $k_{B}$ the Boltzmann constant, $T$ the temperature, $\phi$ the electrostatic potential, $\varepsilon_{0}$ the vacuum permittivity, $\varepsilon_{\mathrm{r}}$ the relative permittivity, $\rho$ the fluid density, $\vec{u}$ the fluid velocity, $p$ the hydrostatic pressure, $\eta$ the dynamic viscosity, and $\vec{f}_{\mathrm{ext}}$ an external force density.
The first system that is simulated in this tutorial is the simple advection-diffusion of a drop of uncharged chemical species in a constant velocity field. To keep the computation time small, we restrict ourselves to a 2D problem, but the algorithm is also capable of solving the 3D advection-diffusion equation. Furthermore, we can also skip solving the electrostatic Poisson equation, since there are no charged species present. The equations we solve thus reduce to
\begin{equation} \partial_{t} n = D \Delta n - \vec{\nabla} \cdot (\vec{v} n). \end{equation}The fundamental solution of this partial diffential equation can be found analytically in the case of a constant velocity field $\vec{v}$ and a constant diffusion coefficient $D$. For a $d$-dimensional system, the solution of an initally infinitessimaly small droplet at the origin can be written as
\begin{equation} n(\vec{x},t) = \frac{1}{(4 \pi D t)^{d/2}} \exp \left( - \frac{(\vec{x} - \vec{v} t)^2}{4 D t} \right). \end{equation}After importing the necessary packages, we start by defining the necessary parameters for the simulation.
import espressomd
import espressomd.lb
import espressomd.electrokinetics
import espressomd.shapes
espressomd.assert_features(["WALBERLA", "WALBERLA_FFT"])
import tqdm
import numpy as np
import scipy.optimize
import matplotlib as mpl
import matplotlib.pyplot as plt
import matplotlib.animation as animation
import matplotlib.quiver
import tempfile
import base64
plt.rcParams.update({'font.size': 16})
BOX_L = [80, 80, 1]
AGRID = 1.0
DIFFUSION_COEFFICIENT = 0.06
TAU = 1.0
EXT_FORCE_DENSITY = [0, 0, 0]
FLUID_DENSITY = 1.0
FLUID_VISCOSITY = 1.
FLUID_VELOCITY = [0.04, 0.04, 0.0]
KT = 1.0
RUN_TIME = 400
system = espressomd.System(box_l=BOX_L)
system.time_step = TAU
system.cell_system.skin = 0.4
We use a lattice Boltzmann flow field with constant velocity for advection.
Note that we have to set kT=0.0
here to avoid random fluctuations in the flow velocity.
lattice = espressomd.lb.LatticeWalberla(n_ghost_layers=1, agrid=AGRID)
lbf = espressomd.lb.LBFluidWalberla(
lattice=lattice, density=FLUID_DENSITY, kinematic_viscosity=FLUID_VISCOSITY,
tau=TAU, ext_force_density=EXT_FORCE_DENSITY, kT=0.0, seed=42)
lbf[:, :, :].velocity = FLUID_VELOCITY
system.lb = lbf
To use the electrokinetics-algorithm in ESPResSo, one needs to create an instance of the EKContainer
-object and pass it a time step tau
and Poisson solver solver
.
Since our species is uncharged, we don't need to solve the electrostatic Poisson equation, so we can use the placeholder-class, which is called EKNone
.
eksolver = espressomd.electrokinetics.EKNone(lattice=lattice)
system.ekcontainer = espressomd.electrokinetics.EKContainer(tau=TAU, solver=eksolver)
Now, we can add diffusive species to the container to integrate their dynamics.
espressomd.electrokinetics.EKSpecies
and add it to the system with system.ekcontainer.add()
. DIFFUSION_COEFFICIENT
, KT
and TAU
defined above.advection
and friction_coupling
.density
with 0.0, and disable electrostatics by setting valency
to 0.0 as well.# SOLUTION CELL
species = espressomd.electrokinetics.EKSpecies(
lattice=lattice, density=0.0, kT=KT,
diffusion=DIFFUSION_COEFFICIENT, valency=0.0,
advection=True, friction_coupling=True,
ext_efield=[0., 0., 0.], tau=TAU)
system.ekcontainer.add(species)
To compare our simulation to the fundamental solution of the advection-diffusion equation, we need to approximate a delta-droplet, which can be achieved by having a non-zero density only at the center of the domain.
system.ekcontainer[0][BOX_L[0] // 2, BOX_L[1] // 2, 0].density = 1.0
Now everything is set and we can finally run the simulation by running the integrator.
system.integrator.run(RUN_TIME)
For comparison, we prepare the analytical solution and show the 2D-density as well as a slice through the center of the droplet.
def calc_gaussian(pos: np.ndarray, time: int, D: float):
dim = pos.shape[-1]
return (4 * np.pi * D * time)**(-dim / 2) * np.exp(-np.sum(np.square(pos), axis=-1) / (4 * D * time))
pos = np.zeros((*BOX_L[:2], 2))
xpos = np.arange(-BOX_L[0] // 2, BOX_L[0] // 2)
ypos = np.arange(-BOX_L[1] // 2, BOX_L[1] // 2)
pos[..., 1], pos[..., 0] = np.meshgrid(xpos, ypos)
# add the advection shift
pos -= np.asarray(FLUID_VELOCITY[:2]) * RUN_TIME * TAU
analytic_density = calc_gaussian(pos=pos, time=RUN_TIME * TAU, D=DIFFUSION_COEFFICIENT)
fig, (ax1, ax2) = plt.subplots(ncols=2, nrows=1, figsize=(15, 7))
ax1.imshow(system.ekcontainer[0][:, :, 0].density, origin="lower", vmin=0, vmax=6e-3)
ax1.set_title("simulation")
imshow = ax2.imshow(analytic_density, origin="lower", vmin=0, vmax=6e-3)
ax2.set_title("analytic")
fig.colorbar(imshow, ax=[ax1, ax2], shrink=0.8)
plt.show()
values_diagonal = np.diagonal(system.ekcontainer[0][:, :, 0].density)
analytic_diagonal = np.diagonal(analytic_density)
positions_diagonal = np.arange(len(values_diagonal)) * np.sqrt(2) * AGRID
def gaussian_kernel(x, magnitude, mu, sigma):
return magnitude * np.exp(-(x - mu)**2 / (2 * sigma**2))
popt, pcov = scipy.optimize.curve_fit(gaussian_kernel, positions_diagonal, analytic_diagonal, p0=[0.05,70,5.])
positions_analytic = np.concatenate([[positions_diagonal[0]],
np.linspace(popt[1] - 5 * popt[2], popt[1] + 5 * popt[2], 120),
[positions_diagonal[-1]]])
values_analytic = gaussian_kernel(positions_analytic, *popt)
fig = plt.figure(figsize=(8, 5))
ax = fig.gca()
ax.plot(positions_diagonal, values_diagonal, "o", mfc="none", label="simulation")
ax.plot(positions_analytic, values_analytic, label="analytic")
ax.set_xlabel("position")
ax.set_ylabel("density")
plt.legend()
plt.show()
From the plot one can see that the position of the density-peak matches well. However, one also sees that the droplet in the simulation has spread more than it should. The reason is that the discretization used for the advection term introduces an artifical, additional diffusion to the system. This is a fundamental limitation of the algorithm, which is why it cannot be applied to pure advection problems.
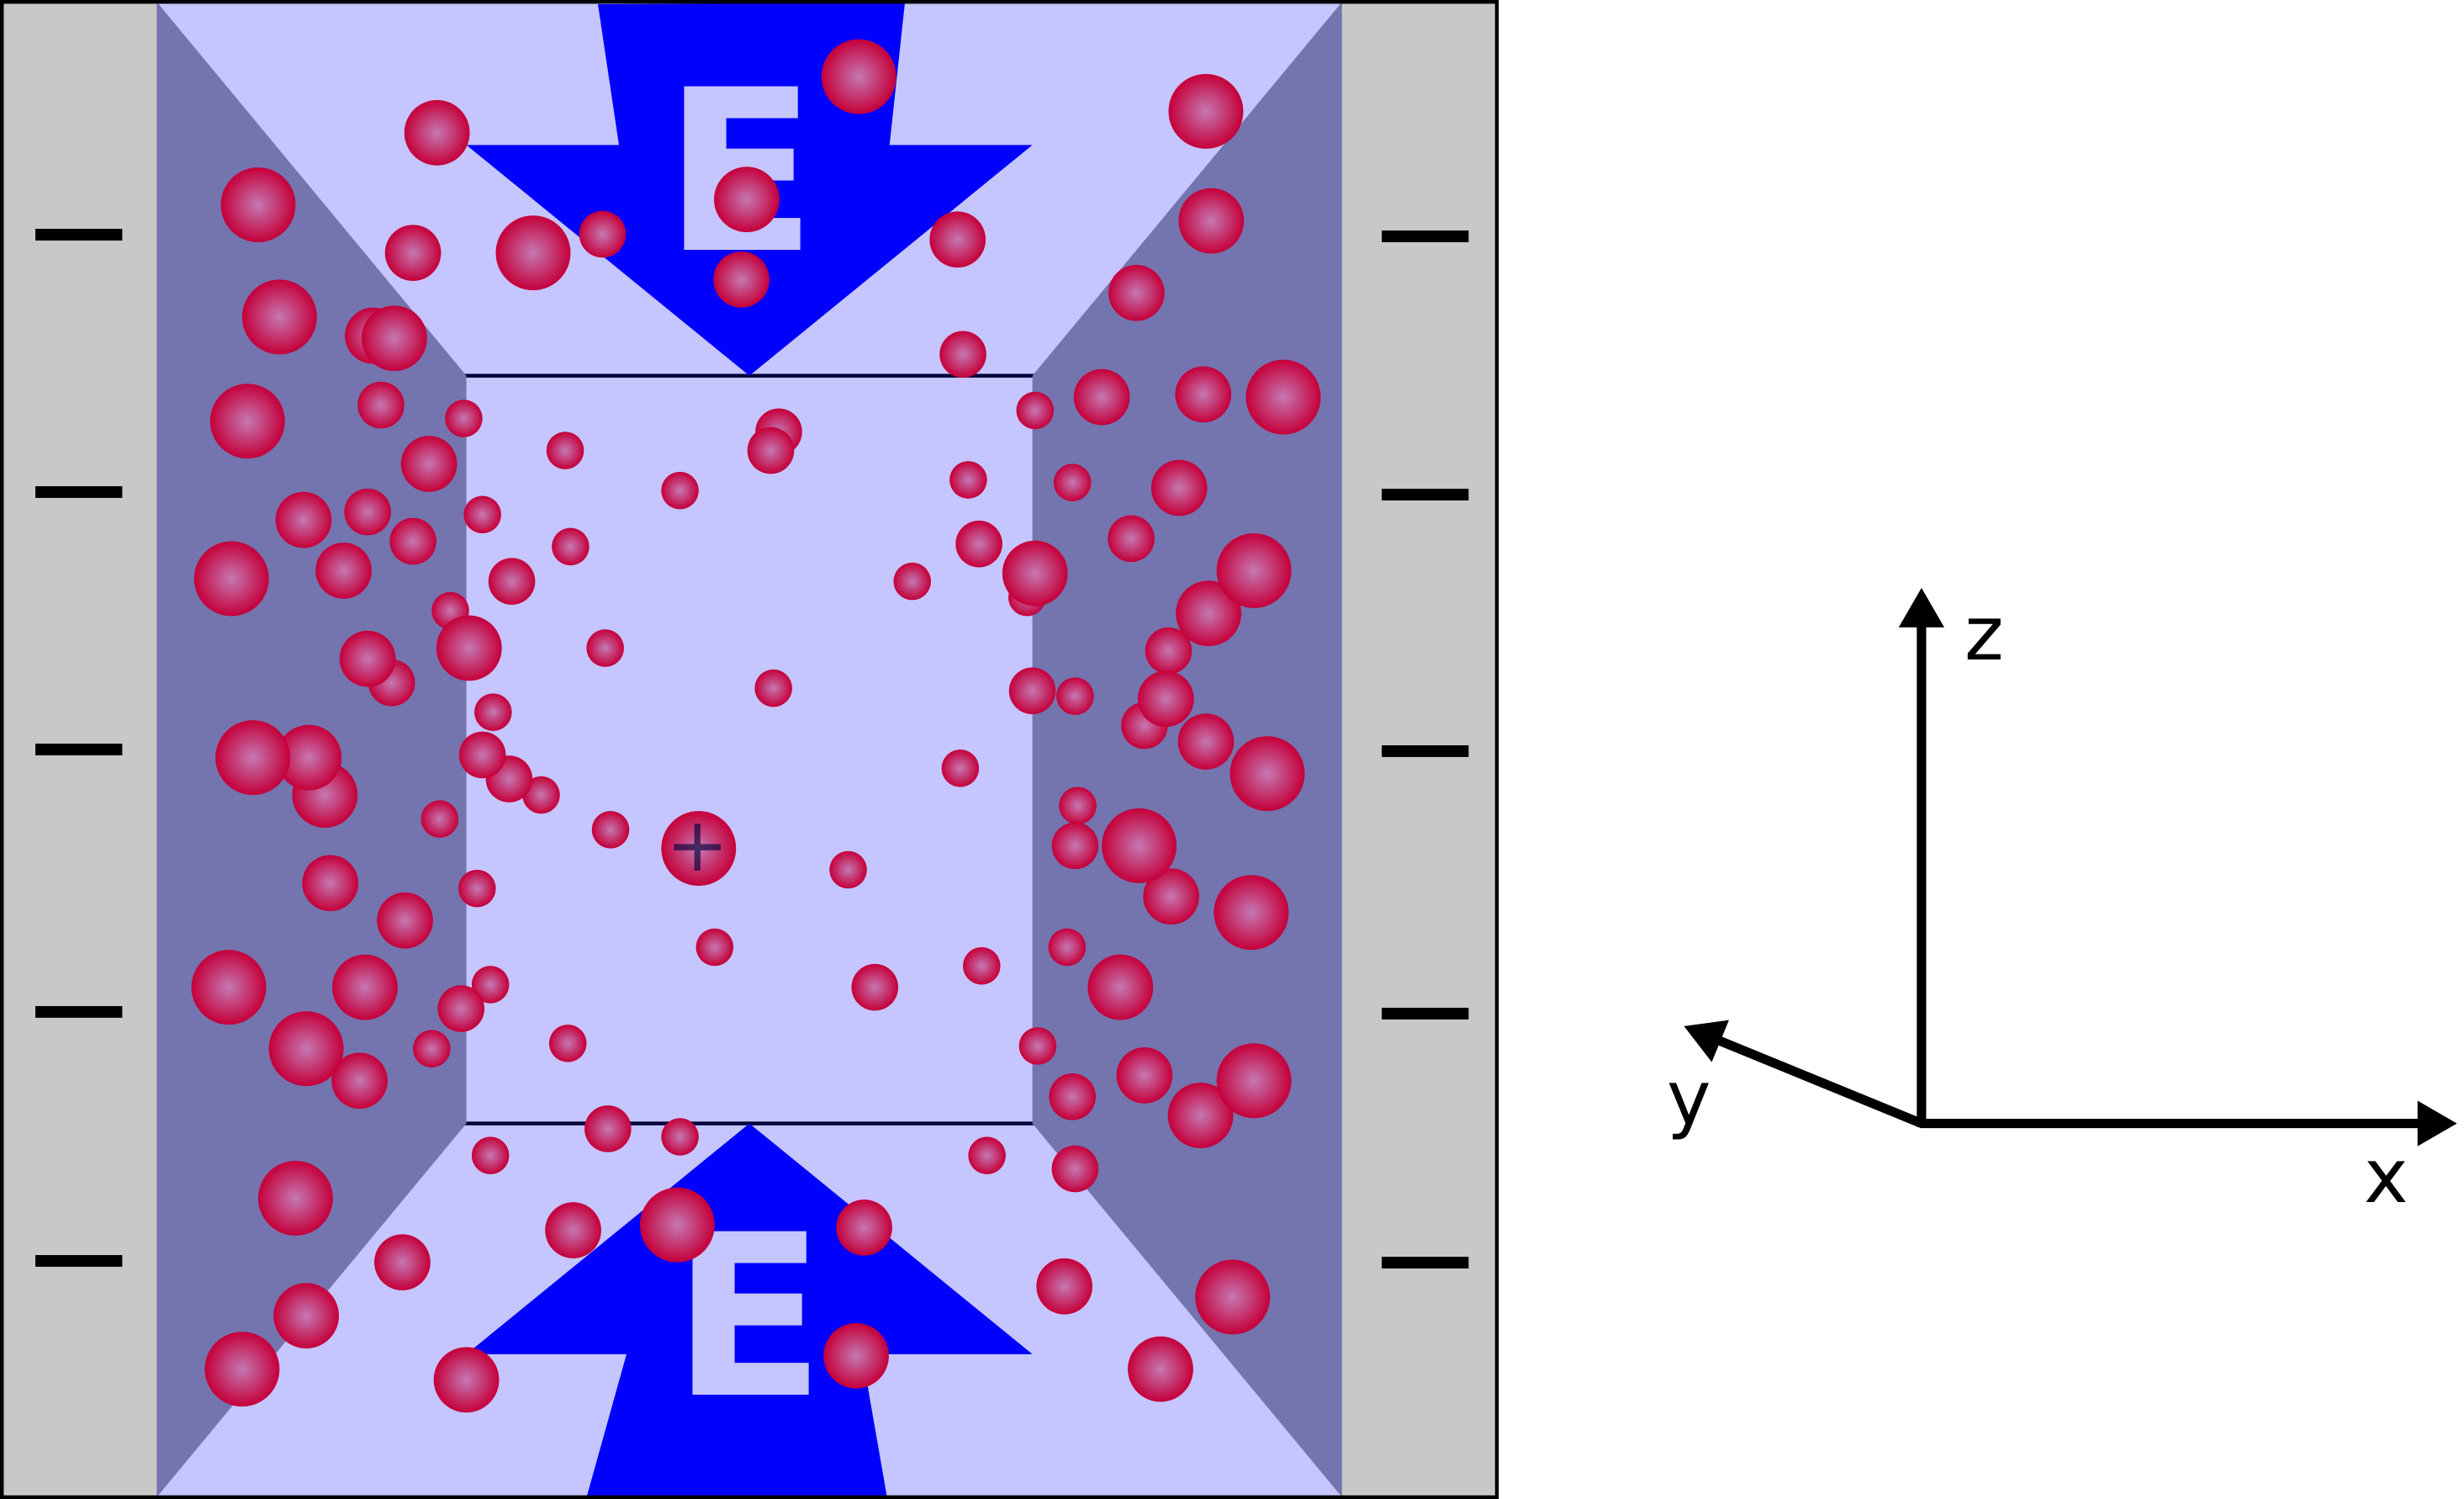
The next system in this tutorial is a simple slit pore, as shown in Figure 1. It consists of an infinite plate capacitor with an electrolytic solution trapped in between the plates. The plates of the capactior carry a constant surface charge and the counterions are solvated in the liquid.
Charge attraction will cause the ions to accumulate near the surfaces, forming a characteristic ion density profile, which can be calculated analytically using the Poisson-Boltzmann equation. Since the system has translational symmetry in the directions parallel to the plates, the equations for parallel and orthogonal direction decouple. This means that applying an external electric field in a direction parallel to the plates will not change the distribution of the ions along the orthogonal direction. It will however cause motion of the ions and consequently the fluid: The characteristic flow profile of electroosmotic flow.
Due to the symmetries of the system, it effectively reduces to a 1D problem along the orthogonal axis. The system can be described by the Poisson-Boltzmann equation:
$$ \partial_{x}^2 \phi(x) = \frac{1}{\varepsilon_{0} \varepsilon_{\mathrm{r}}} \sum_{i} z_{i} e n_{i}(x) \exp \left( -\frac{z_{i} e \phi(x)}{k_{\mathrm{B}} T} \right) $$where $x$ is the normal-direction of the plates. Since we will only simulate a single ion species, the counterions, the sum only has a single summand. The solution for the potential is then given by:
$$ \phi(x) = -\frac{k_{B}T}{z e} \log \left[ \frac{C^2 \varepsilon_{0} \varepsilon_{\mathrm{r}}}{2 k_{B}T } \cos^{-2} \left( \frac{z e C}{2 k_{B} T} x \right) \right], \qquad \text{with } \left\| \frac{z e C}{2 k_{B} T} \right\| < \frac{\pi}{2}, $$where $C$ is an integration constant that is to be determined by the boundary conditions. The ion density follows then from the potential as
$$ n(x) = \frac{C^2 \varepsilon_{0} \varepsilon_{\mathrm{r}}}{2 k_{B}T} \cos^{-2} \left( \frac{z e C}{2 k_{B} T} x \right). $$To find the integration constant we use fact that the total system has to be charge neutral, i.e., the total charge on the plates is counterbalanced by the counterions. This leads to the following equation
$$ C \tan \left( \frac{z e d}{4 k_{B} T} C \right) = - \frac{e^2}{\varepsilon_{0} \varepsilon_{\mathrm{r}}} \sigma, $$where $\sigma$ is the surface charge density of the plates. This is a transcendental equation, which must be solved numerically to find $C$.
The electric field is applied in the $y$-direction, parallel to the plates. Fluid flow is described by the incompressible Navier-Stokes equation, which due to the symmetries of the system reduces to the one-dimensional problem
$$ \frac{\partial^2 v_{y}(x)}{\partial x^2} = - \frac{\varepsilon_{0} \varepsilon_{\mathrm{r}} z e E C^2}{2 k_{B}T \eta} \cos^{-2}\left( \frac{q C}{2 k_{B} T} x \right). $$This equation can be solved analytically and the solution is given by
$$ v_{y}(x) = \frac{2 \varepsilon_{0} \varepsilon_{\mathrm{r}} k_{B} T E}{\eta z e} \log \left( \frac{\cos \left( \displaystyle\frac{z e C}{2 k_{B} T} x \right)}{\cos \left( \displaystyle\frac{z e C}{2 k_{B} T} \frac{d}{2} \right)} \right), $$where $d$ denotes the distance between the two plates. Finally, the shear-stress of this problem is given by
$$ \sigma(x) = \mu \frac{\partial v_{y}(x)}{\partial x} $$We start by resetting the system and defining the necessary parameters.
system.ekcontainer = None
system.lb = None
AGRID = 1.0
TAU = 1.0
KT = 2.0
PERMITTIVITY = 0.28
DIFFUSION_COEFFICIENT = 0.25
VALENCY = 1.0
VISCOSITY_DYNAMIC = 0.5
DENSITY_FLUID = 1.0
SURFACE_CHARGE_DENSITY = -0.05
EXT_FORCE_DENSITY = [0.0, 0.01, 0.0]
SINGLE_PRECISION = False
padding = 1
WIDTH = 126
BOX_L = [(WIDTH + 2 * padding) * AGRID, 1, 1]
system.cell_system.skin = 0.4
system.box_l = BOX_L
system.time_step = TAU
RUN_TIME = 200
We can now set up the electrokinetics algorithm as in the first part of the tutorial, starting with the LB-method.
lattice = espressomd.lb.LatticeWalberla(agrid=AGRID, n_ghost_layers=1)
viscosity_kinematic = VISCOSITY_DYNAMIC / DENSITY_FLUID
lbf = espressomd.lb.LBFluidWalberla(lattice=lattice, density=DENSITY_FLUID,
kinematic_viscosity=viscosity_kinematic,
tau=TAU, single_precision=SINGLE_PRECISION)
system.lb = lbf
Since our species are going to carry a charge now, we need to solve the full electrostatic problem. For that, we have to specify an actual solver.
system.ekcontainer
.# SOLUTION CELL
eksolver = espressomd.electrokinetics.EKFFT(lattice=lattice, permittivity=PERMITTIVITY,
single_precision=SINGLE_PRECISION)
system.ekcontainer = espressomd.electrokinetics.EKContainer(tau=TAU, solver=eksolver)
To simulate the system, we will use two different ion species: The counterions are propagated in the fluid. The second species will be used to describe the surface charge on the plates and therefore has to be stationary (i.e. no advection, no diffusion).
ekspecies = espressomd.electrokinetics.EKSpecies(lattice=lattice, density=0.0, kT=KT, diffusion=DIFFUSION_COEFFICIENT, valency=VALENCY, advection=True, friction_coupling=True, ext_efield=EXT_FORCE_DENSITY, single_precision=SINGLE_PRECISION, tau=TAU)
system.ekcontainer.add(ekspecies)
ekwallcharge = espressomd.electrokinetics.EKSpecies(lattice=lattice, density=0.0, kT=KT, diffusion=0., valency=-VALENCY, advection=False, friction_coupling=False, ext_efield=[0, 0, 0], single_precision=SINGLE_PRECISION, tau=TAU)
system.ekcontainer.add(ekwallcharge)
Now we set the initial conditions for the ion densities. The counterions will be initialized with a homogeneous distribution, excluding the cells used as boundaries. The surface charge density is homogeneously distributed in the boundary cells.
density_counterions = -2.0 * SURFACE_CHARGE_DENSITY / VALENCY / WIDTH
ekspecies[padding:-padding, :, :].density = density_counterions
ekspecies[:padding, :, :].density = 0.0
ekspecies[-padding:, :, :].density = 0.0
ekwallcharge[:padding, :, :].density = -SURFACE_CHARGE_DENSITY / VALENCY / padding
ekwallcharge[-padding:, :, :].density = -SURFACE_CHARGE_DENSITY / VALENCY / padding
We now have to specify the boundary conditions. For this, we use ESPResSo'sshapes
.
wall_left = espressomd.shapes.Wall(normal=[1, 0, 0], dist=padding)
wall_right = espressomd.shapes.Wall(normal=[-1, 0, 0], dist=-(padding + WIDTH))
At both of them we specify no-flux and zero-density boundary conditions for the counterions. Furthermore, we set a no-slip boundary condition for the fluid.
At both walls, set
ekspecies
)lbf
)add_boundary_from_shape
for EK species and LB fluids# SOLUTION CELL
for wall in (wall_left, wall_right):
ekspecies.add_boundary_from_shape(shape=wall, value=[0., 0., 0.], boundary_type=espressomd.electrokinetics.FluxBoundary)
ekspecies.add_boundary_from_shape(shape=wall, value=0.0, boundary_type=espressomd.electrokinetics.DensityBoundary)
lbf.add_boundary_from_shape(shape=wall, velocity=[0., 0., 0.])
Now we can finally integrate the system and extract the ion density profile, the fluid velocity profile as well as the pressure-tensor profile.
for i in tqdm.trange(80):
system.integrator.run(RUN_TIME)
100%|██████████| 80/80 [00:06<00:00, 12.02it/s]
mid_y = int(system.box_l[1] / (2 * AGRID))
mid_z = int(system.box_l[2] / (2 * AGRID))
density_eof = ekspecies[padding:-padding, mid_y, mid_z].density
velocity_eof = lbf[padding:-padding, mid_y, mid_z].velocity[:, 1]
pressure_tensor_eof = lbf[padding:-padding, mid_y, mid_z].pressure_tensor[:, 0, 1]
positions = (np.arange(len(density_eof)) - WIDTH / 2 + 0.5) * AGRID
For comparison, we calculate the analytic solution
def transcendental_equation(c, distance, kT, sigma, valency, permittivity) -> float:
elementary_charge = 1.0
return c * np.tan(valency * elementary_charge * distance / (4 * kT) * c) + sigma / permittivity
solution = scipy.optimize.fsolve(func=transcendental_equation, x0=0.001, args=(WIDTH, KT, SURFACE_CHARGE_DENSITY, VALENCY, PERMITTIVITY))
def eof_density(x, c, permittivity, elementary_charge, valency, kT):
return c**2 * permittivity / (2 * kT) / (np.cos(valency * elementary_charge * c / (2 * kT) * x))**2
def eof_velocity(x, c, permittivity, elementary_charge, valency, kT, ext_field, distance, viscosity):
return 2 * kT * ext_field * permittivity / (viscosity * elementary_charge * valency) * np.log(np.cos(valency * elementary_charge * c / (2 * kT) * x) / np.cos(valency * elementary_charge * c / (2 * kT) * distance / 2))
def eof_pressure_tensor(x, c, elementary_charge, valency, kT, ext_field, permittivity):
return permittivity * ext_field * c * np.tan(valency * elementary_charge * c / (2 * kT) * x)
analytic_density_eof = eof_density(x=positions, c=solution, permittivity=PERMITTIVITY, elementary_charge=1.0, valency=VALENCY, kT=KT)
analytic_velocity_eof = eof_velocity(x=positions, c=solution, permittivity=PERMITTIVITY, elementary_charge=1.0, valency=VALENCY, kT=KT, ext_field=EXT_FORCE_DENSITY[1], distance=WIDTH, viscosity=VISCOSITY_DYNAMIC)
analytic_pressure_tensor_eof = eof_pressure_tensor(x=positions, c=solution, elementary_charge=1.0, valency=VALENCY, kT=KT, ext_field=EXT_FORCE_DENSITY[1], permittivity=PERMITTIVITY)
fig1 = plt.figure(figsize=(16, 4.5))
fig1.suptitle("electroosmotic flow")
ax = fig1.add_subplot(131)
ax.plot(positions, density_eof, "o", mfc="none", markevery=0.015, label="simulation")
ax.plot(positions, analytic_density_eof, label="analytic")
ax.set_xlabel("x-position")
ax.set_ylabel("Counter-ion density")
ax.ticklabel_format(axis="y", style="scientific", scilimits=(0, 0))
ax.legend(loc="best")
ax = fig1.add_subplot(132)
ax.plot(positions, velocity_eof, "o", mfc="none", markevery=0.015, label="simulation")
ax.plot(positions, analytic_velocity_eof, label="analytic")
ax.set_xlabel("x-position")
ax.set_ylabel("Fluid velocity")
ax.ticklabel_format(axis="y", style="scientific", scilimits=(0, 0))
ax.legend(loc="best")
ax = fig1.add_subplot(133)
ax.plot(positions, pressure_tensor_eof, "o", mfc="none", markevery=0.015, label="simulation")
ax.plot(positions, analytic_pressure_tensor_eof, label="analytic")
ax.set_xlabel("x-position")
ax.set_ylabel("Fluid shear stress xz")
ax.ticklabel_format(axis="y", style="scientific", scilimits=(0, 0))
ax.legend(loc="best")
plt.tight_layout()
plt.show()
In the plots one can see that the analytic solution for the electroosmotic flow matches the simulation very well.
We can compare electroosmotic flow to pressure-driven flow. For this, we turn off the external electric field and enable a constant external force density on the fluid.
EXT_FORCE_DENSITY = [0.0, 0.000004, 0.0]
ekspecies.ext_efield = [0.0, 0.0, 0.0]
lbf.ext_force_density = EXT_FORCE_DENSITY
for i in tqdm.trange(70):
system.integrator.run(RUN_TIME)
100%|██████████| 70/70 [00:05<00:00, 11.93it/s]
density_pressure = ekspecies[padding:-padding, mid_y, mid_z].density
velocity_pressure = lbf[padding:-padding, mid_y, mid_z].velocity[:, 1]
pressure_tensor_pressure = lbf[padding:-padding, mid_y, mid_z].pressure_tensor[:, 0, 1]
The analytic solution for pressure-driven flow between two infinite parallel plates is known as the Poiseuille flow.
def pressure_velocity(x, distance, ext_field, viscosity):
return ext_field / (2 * viscosity) * (distance**2 / 4 - x**2)
def pressure_pressure_tensor(x, ext_field):
return ext_field * x
analytic_velocity_pressure = pressure_velocity(x=positions, distance=WIDTH, ext_field=EXT_FORCE_DENSITY[1], viscosity=VISCOSITY_DYNAMIC)
analytic_pressure_tensor_pressure = pressure_pressure_tensor(x=positions, ext_field=EXT_FORCE_DENSITY[1])
fig1 = plt.figure(figsize=(16, 4.5))
fig1.suptitle("pressure-driven flow")
ax = fig1.add_subplot(131)
ax.plot(positions, density_pressure, "o", mfc="none", markevery=0.015, label="simulation")
ax.plot(positions, analytic_density_eof, label="analytic")
ax.set_xlabel("x-position")
ax.set_ylabel("counter-ion density")
ax.ticklabel_format(axis="y", style="scientific", scilimits=(0, 0))
ax.legend(loc="best")
ax = fig1.add_subplot(132)
ax.plot(positions, velocity_pressure, "o", mfc="none", markevery=0.015, label="simulation")
ax.plot(positions, analytic_velocity_pressure, label="analytic")
ax.set_xlabel("x-position")
ax.set_ylabel("fluid velocity")
ax.ticklabel_format(axis="y", style="scientific", scilimits=(0, 0))
ax.legend(loc="best")
ax = fig1.add_subplot(133)
ax.plot(positions, pressure_tensor_pressure, "o", mfc="none", markevery=0.015, label="simulation")
ax.plot(positions, analytic_pressure_tensor_pressure, label="analytic")
ax.set_xlabel("x-position")
ax.set_ylabel("fluid shear stress xz")
ax.ticklabel_format(axis="y", style="scientific", scilimits=(0, 0))
ax.legend(loc="best")
plt.tight_layout()
plt.show()
As one can again see, the body force on the fluid did non alter the ion-density profile. However, because the force now applies homogeneously on the whole fluid, the flow profile looks parabolic.
To see the difference between the two types of flows, we plot the simulation data together in one plot.
fig1 = plt.figure(figsize=(16, 4.5))
fig1.suptitle("electroosmotic vs. pressure-driven flow comparison")
ax = fig1.add_subplot(131)
ax.plot(positions, density_eof, "o", mfc="none", ms=4, markevery=0.015, label="eof")
ax.plot(positions, density_pressure, "o", mfc="none", markevery=0.015, label="pressure")
ax.set_xlabel("x-position")
ax.set_ylabel("counter-ion density")
ax.ticklabel_format(axis="y", style="scientific", scilimits=(0, 0))
ax.legend(loc="best")
ax = fig1.add_subplot(132)
ax.plot(positions, velocity_eof, "o", mfc="none", markevery=0.015, label="eof")
ax.plot(positions, velocity_pressure, "o", mfc="none", markevery=0.015, label="pressure")
ax.set_xlabel("x-position")
ax.set_ylabel("fluid velocity")
ax.ticklabel_format(axis="y", style="scientific", scilimits=(0, 0))
ax.legend(loc="best")
ax = fig1.add_subplot(133)
ax.plot(positions, pressure_tensor_eof, "o", mfc="none", markevery=0.015, label="eof")
ax.plot(positions, pressure_tensor_pressure, "o", mfc="none", markevery=0.015, label="pressure")
ax.set_xlabel("x-position")
ax.set_ylabel("fluid shear stress xz")
ax.ticklabel_format(axis="y", style="scientific", scilimits=(0, 0))
ax.legend(loc="best")
plt.tight_layout()
plt.show()
Looking at the fluid velocity plot, one can see that the electroosmotic flow profile flattens significantly faster towards the center of the channel when compared to the pressure driven flow. The reason for this is the accumulation of the counterion-density towards the oppositely charged plates. Here, the driving electric field causes the highest force on the fluid, which decays towards the center of the channel. In contrast, the Poiseuille-flow is driven by a constant, uniform driving force.
To showcase the reaction feature of our electrokinetics algorithm, we simulate a simple reaction in complex flow. For this, we choose a geometry of rigid cylinders. At large flow velocities, a Kármán vortex street, i.e., a repeating pattern of swirling vorticies behind the obstacle, develops.
To this flow, we will add several species undergoing advection-diffusion, which is dominated by the downstream fluid flow in the channel. The reaction will be included as a bulk-reaction, which means that the reaction can happen anywhere, the only requirement is that both species are present in the same lattice cell. When the reaction occurs, parts of the reactant species will turn into the product. How much of the species will transform within each timestep is determined by the respective reaction rate and the overall structure of the reaction.
We start again by resetting the system and defining parameters.
system.ekcontainer = None
system.lb = None
BOX_L = [80, 32, 1]
AGRID = 1.0
DIFFUSION_COEFFICIENT = 0.01
TAU = 0.03
EXT_FORCE_DENSITY = [0.6, 0, 0]
OBSTACLE_RADIUS = 6
DENSITY_FLUID = 0.5
VISCOSITY_KINEMATIC = 2.0
KT = 1.0
TOTAL_FRAMES = 50
system.time_step = TAU
system.cell_system.skin = 0.4
system.box_l = BOX_L
lattice = espressomd.lb.LatticeWalberla(n_ghost_layers=1, agrid=AGRID)
lbf = espressomd.lb.LBFluidWalberla(
lattice=lattice, density=DENSITY_FLUID, kinematic_viscosity=VISCOSITY_KINEMATIC,
tau=TAU, ext_force_density=EXT_FORCE_DENSITY, kT=KT, seed=42)
system.lb = lbf
system.thermostat.set_lb(LB_fluid=lbf, seed=42, gamma=0.)
eksolver = espressomd.electrokinetics.EKNone(lattice=lattice)
system.ekcontainer = espressomd.electrokinetics.EKContainer(tau=TAU, solver=eksolver)
Now we can focus on the reactions. In this tutorial we choose the simple case of $A + B \rightarrow C$, which means that equal parts of the educt species $A$ and $B$ can turn into the product species $C$. ESPResSo distinguishes between educts and products by the sign of their respective stoechiometric coefficients, where educts have negative coefficients and products positive coefficients. Intuitively this can be understood that when a reaction happens, the density of the educts will decrease, hence the stoechiometric coefficient is negative.
The reaction rate constant $r$ is the rate at which the reaction happens. The order $O_i$ for a species $i$ specifies to which order the reaction depends on the density of that species. Positive orders mean that the reaction is faster the more density of this species is present, for negative orders the reaction slows down with higher density. In general, this process can be written as $\Gamma = r \left[ A \right]^{O_A} \left[ B \right]^{O_B} \left[ C \right]^{O_C}$, where $\Gamma$ is known as the reaction rate. This is sometimes also called the rate equation.
For our specific simulation this means that all stoechiometric coefficients are $-1$ for the educts and $+1$ for the product. We choose the order of the educts as $1$ and the order of the product as $0$. This means that the more amount of both educts is present, the more will react and the amount of product present won't have an influence.
REACTION_RATE_CONSTANT = 2.5
EDUCT_COEFFS = [-1, -1]
EDUCT_ORDERS = [1,1]
PRODUCT_COEFFS = [1]
PRODUCT_ORDERS = [0]
We create each involved species and directly specify their boundary-conditions for the domain-boundaries. We set the initial density of the species to 0 and also add Dirichlet boundary conditions of zero density at both the inlet and the outlet of the system.
educt_species = []
product_species = []
reactants = []
for coeff, order in zip(EDUCT_COEFFS, EDUCT_ORDERS):
species = espressomd.electrokinetics.EKSpecies(
lattice=lattice, density=0.0, kT=KT,
diffusion=DIFFUSION_COEFFICIENT, valency=0.0,
advection=True, friction_coupling=True,
ext_efield=[0., 0., 0.], tau=TAU)
system.ekcontainer.add(species)
reactants.append(
espressomd.electrokinetics.EKReactant(
ekspecies=species,
stoech_coeff=coeff,
order=order))
educt_species.append(species)
species[0,:,:].density_boundary = espressomd.electrokinetics.DensityBoundary(0.0)
species[-1,:,:].density_boundary = espressomd.electrokinetics.DensityBoundary(0.0)
for coeff, order in zip(PRODUCT_COEFFS, PRODUCT_ORDERS):
species = espressomd.electrokinetics.EKSpecies(
lattice=lattice, density=0.0, diffusion=DIFFUSION_COEFFICIENT,
kT=KT, valency=0.0, advection=True, friction_coupling=True,
ext_efield=[0., 0., 0.], tau=TAU)
system.ekcontainer.add(species)
reactants.append(
espressomd.electrokinetics.EKReactant(
ekspecies=species,
stoech_coeff=coeff,
order=order))
product_species.append(species)
species[0,:,:].density_boundary = espressomd.electrokinetics.DensityBoundary(0.0)
species[-1,:,:].density_boundary = espressomd.electrokinetics.DensityBoundary(0.0)
EKBulkReaction
using the previously created reactants
and activate the reaction by adding it to system.ekcontainer.reactions
.# SOLUTION CELL
reaction = espressomd.electrokinetics.EKBulkReaction(
reactants=reactants, coefficient=REACTION_RATE_CONSTANT, lattice=lattice, tau=TAU)
system.ekcontainer.reactions.add(reaction)
The next thing to add to the system is the cylindrical obstacles, which act as the boundaries for the Kármán vortices to form. These are placed close to the inlet of the system and also act as impenetrable boundaries for the species. Since ESPResSo uses periodic boundary conditions, we need to add a total of three cylinders to the system, which will form two complete cylinders in the periodic system.
cylinder_centers = [
[BOX_L[0] // 10, 0, 1],
[BOX_L[0] // 10, BOX_L[1] // 2, 1],
[BOX_L[0] // 10, BOX_L[1], 1],
]
shape_cylinder = []
for cylinder_center in cylinder_centers:
shape_cylinder.append(espressomd.shapes.Cylinder(
center=cylinder_center,
axis=[0, 0, 1],
length=BOX_L[2],
radius=OBSTACLE_RADIUS,
))
for shape in shape_cylinder:
lbf.add_boundary_from_shape(shape)
for spec in (*educt_species, *product_species):
spec.add_boundary_from_shape(shape, value=[0,0,0], boundary_type=espressomd.electrokinetics.FluxBoundary)
spec.add_boundary_from_shape(shape, value=0., boundary_type=espressomd.electrokinetics.DensityBoundary)
Up to this point there is no species present anywhere in the system and also no way for it to enter the system. Since the reaction is irreversible in our setup, we need to introduce some density of both the educt species to the system. For that we set two additional Dirichlet boundary conditions (sources) in the domain, where we fix the species' density to a constant, non-zero value. The sources are placed some distance apart such that the reaction happens further downstream when diffusion mixes the two species.
source_boundary = espressomd.electrokinetics.DensityBoundary(10.0)
source_x_pos = BOX_L[1] // 20
educt_species[0][source_x_pos,BOX_L[1]//4-1:BOX_L[1]//4+1,:].density_boundary = source_boundary
educt_species[1][source_x_pos,3*(BOX_L[1]//4)-1:3*(BOX_L[1]//4)+1,:].density_boundary = source_boundary
With this, the system is now finally complete and we can start the integration. To see the system evolve, we will render a movie from the timeseries of the system. For that we have to setup some helper functions for the plotting, which are beyond the scope of this tutorial.
VIDEO_TAG = """<video controls>
<source src="data:video/x-m4v;base64,{0}" type="video/mp4">
Your browser does not support the video tag.
</video>"""
# set ignore 'divide' and 'invalid' errors
# these occur when plotting the flowfield containing a zero velocity
np.seterr(divide='ignore', invalid='ignore')
def anim_to_html(anim):
if not hasattr(anim, '_encoded_video'):
with tempfile.NamedTemporaryFile(suffix='.mp4') as f:
anim.save(f.name, fps=20, extra_args=['-vcodec', 'libx264'])
with open(f.name, "rb") as g:
video = g.read()
anim._encoded_video = base64.b64encode(video).decode('ascii')
plt.close(anim._fig)
return VIDEO_TAG.format(anim._encoded_video)
animation.Animation._repr_html_ = anim_to_html
get_colormap = mpl.colormaps.get_cmap if hasattr(mpl.colormaps, "get_cmap") else mpl.cm.get_cmap
box_width = lattice.shape[1]
box_height = lattice.shape[0]
boundary_mask = lbf[:, :, 0].boundary != None
cmap = get_colormap("viridis").copy()
cmap.set_bad(color="gray")
cmap_quiver = get_colormap("binary").copy()
cmap_quiver.set_bad(color="gray")
# setup figure and prepare axes
fig = plt.figure(figsize=(9.8, 5.5))
imshow_kwargs = {"origin": "upper", "extent": (0, BOX_L[1], BOX_L[0], 0)}
gs = fig.add_gridspec(1, 4, wspace=0.1)
ax1 = plt.subplot(gs[0])
ax2 = plt.subplot(gs[1], sharey=ax1)
ax3 = plt.subplot(gs[2], sharey=ax1)
ax4 = plt.subplot(gs[3], sharey=ax1)
ax1.set_yticks(np.arange(0, 80 + 1, 16))
ax1.set_xticks(np.arange(0, 32 + 1, 16))
ax2.set_xticks(np.arange(0, 32 + 1, 16))
ax3.set_xticks(np.arange(0, 32 + 1, 16))
ax4.set_xticks(np.arange(0, 32 + 1, 16))
# set the background color for the quiver plot
bg_colors = np.copy(boundary_mask).astype(float)
bg_colors[boundary_mask] = np.NaN
ax4.imshow(bg_colors, cmap=cmap_quiver, **imshow_kwargs)
for ax, title in zip(
[ax1, ax2, ax3, ax4],
["educt 1", "educt 2", "product", "fluid velocity"]
):
ax.set_title(title)
ax.set_xlim((0, box_width))
ax.set_ylim((0, box_height))
# create meshgrid for quiver plot subsampled by a factor 2
xs = np.arange(0, box_width, 2)
ys = np.arange(0, box_height, 2)
X, Y = np.meshgrid(xs, ys)
flowfield = lbf[:, :, 0].velocity[::2, ::2, :]
quiver = ax4.quiver(X + 1., Y + 1., flowfield[..., 1], flowfield[..., 0], scale=100)
fig.subplots_adjust(left=0.025, bottom=0.075, right=0.975, top=0.925, wspace=0.0125)
progress_bar = tqdm.tqdm(total=TOTAL_FRAMES)
def draw_frame(frame):
system.integrator.run(50)
flowfield = np.copy(lbf[:, :, 0].velocity)
e1 = np.copy(educt_species[0][:, :, 0].density)
e2 = np.copy(educt_species[1][:, :, 0].density)
p = np.copy(product_species[0][:, :, 0].density)
# apply the mask for the boundary
e1[boundary_mask] = np.NaN
e2[boundary_mask] = np.NaN
p[boundary_mask] = np.NaN
flowfield[boundary_mask] = np.NaN
ax1.imshow(e1, cmap=cmap, vmin=0., vmax=source_boundary.density, **imshow_kwargs)
ax2.imshow(e2, cmap=cmap, vmin=0., vmax=source_boundary.density, **imshow_kwargs)
ax3.imshow(p, cmap=cmap, vmin=0., vmax=source_boundary.density, **imshow_kwargs)
quiver.set_UVC((flowfield[::2, ::2, 1] + flowfield[1::2, 1::2, 1]) / 2.,
(flowfield[::2, ::2, 0] + flowfield[1::2, 1::2, 0]) / 2.)
progress_bar.update()
animation.FuncAnimation(fig, draw_frame, frames=range(TOTAL_FRAMES), interval=300)
51it [00:23, 1.43it/s]
Looking at the movie of the species densities one can see that the fluid flow advects the educt species from their source locations past the cylinders into the system. Here, they start to mix and react, such that the product forms. The vortex street behind the obstacles enhances mixing through fluid turbulence. The density of the product then increases towards the outflow-location of the channel, where it is deleted because of our zero-density boundary condition.